Texas's 30th congressional district
| Texas's 30th congressional district | |
|---|---|
 Texas's 30th congressional district since January 3, 2023 | |
| Representative | |
| Distribution |
|
| Population (2023) | 772,920[2] |
| Median household income | $70,984[2] |
| Ethnicity |
|
| Cook PVI | D+27[3] |
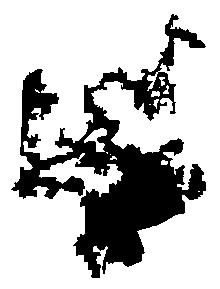
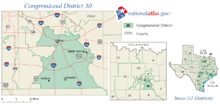
Texas's 30th congressional district of the United States House of Representatives covers much of the city of Dallas and other parts of Dallas and Tarrant counties (primarily black- and Hispanic-majority areas). The district contains the University of North Texas at Dallas, UNT Law, and Texas Woman's University at Dallas. The 30th district is also home to Dallas Love Field airport and University of Texas Southwestern Medical Center.
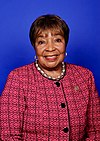
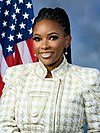
The current Representative from the 30th district is Democrat Jasmine Crockett, who has represented the district since 2023. She succeeded longtime representative Eddie Bernice Johnson, who had served since 1993.
With a Cook Partisan Voting Index rating of D+27, it is the most Democratic district in Texas.[3]
Recent election results from statewide races
[edit]| Year | Office | Results[4] |
|---|---|---|
| 2008 | President | Obama 76% - 23% |
| 2012 | President | Obama 78% - 22% |
| 2014 | Senate | Alameel 75% - 25% |
| Governor | Davis 77% - 23% | |
| 2016 | President | Clinton 77% - 20% |
| 2018 | Senate | O'Rourke 80% - 19% |
| Governor | Valdez 74% - 24% | |
| Lt. Governor | Collier 77% - 21% | |
| Attorney General | Nelson 78% - 20% | |
| 2020 | President | Biden 78% - 21% |
| Senate | Hegar 75% - 23% | |
| 2022 | Governor | O'Rourke 77% - 22% |
| Lt. Governor | Collier 76% - 21% | |
| Attorney General | Mercedes Garza 76% - 21% | |
| Comptroller of Public Accounts | Dudding 74% - 23% |
List of members representing the district
[edit]| Member (Residency) |
Party | Years | Cong ress |
Electoral history | District location |
|---|---|---|---|---|---|
| District established January 3, 1993 | |||||
 Eddie Bernice Johnson (Dallas) |
Democratic | January 3, 1993 – January 3, 2023 |
103rd 104th 105th 106th 107th 108th 109th 110th 111th 112th 113th 114th 115th 116th 117th |
Elected in 1992. Re-elected in 1994. Re-elected in 1996. Re-elected in 1998. Re-elected in 2000. Re-elected in 2002. Re-elected in 2004. Re-elected in 2006. Re-elected in 2008. Re-elected in 2010. Re-elected in 2012. Re-elected in 2014. Re-elected in 2016. Re-elected in 2018. Re-elected in 2020. Retired. |
1993–1997 Parts of Collin, Dallas, and Tarrant |
| 1997–2003 Parts of Dallas | |||||
| 2003–2005 Parts of Dallas | |||||
2005–2013 Parts of Dallas | |||||
2013–2023 Parts of Dallas[5] | |||||
 Jasmine Crockett (Dallas) |
Democratic | January 3, 2023 – present |
118th 119th |
Elected in 2022. Re-elected in 2024. |
2023–present Parts of Dallas and Tarrant[6] |
Recent election results
[edit]2004
[edit]| Party | Candidate | Votes | % | ±% | |
|---|---|---|---|---|---|
| Democratic | Eddie Bernice Johnson (incumbent) | 144,513 | 93.0 | +18.8 | |
| Libertarian | John Davis | 10,821 | 7.0 | +5.4 | |
| Majority | 133,692 | 86.1 | |||
| Turnout | 155,334 | ||||
| Democratic hold | Swing | +21.5 | |||
2006
[edit]The 2006 congressional race for Texas' 30th district was between long-time incumbent Eddie Bernice Johnson, GOP backed long-time district resident Wilson Aurbach, and Libertarian Ken Ashby.
| Party | Candidate | Votes | % | ±% | |
|---|---|---|---|---|---|
| Democratic | Eddie Bernice Johnson (incumbent) | 81,212 | 80.2 | −12.8 | |
| Republican | Wilson Aurbach | 17,820 | 17.6 | N/A | |
| Libertarian | Ken Ashby | 2,245 | 2.2 | −4.8 | |
| Majority | 63,392 | 62.7 | |||
| Turnout | 101,277 | ||||
| Democratic hold | Swing | ||||
2008
[edit]| Party | Candidate | Votes | % | ±% | |
|---|---|---|---|---|---|
| Democratic | Eddie Bernice Johnson (incumbent) | 168,249 | 82.5 | +2.3 | |
| Republican | Fred Wood | 32,361 | 15.9 | −1.7 | |
| Libertarian | Jarrett Woods | 3,366 | 1.6 | −0.6 | |
| Majority | 135,888 | 66.6 | |||
| Turnout | 203,976 | ||||
| Democratic hold | Swing | ||||
2010
[edit]| Party | Candidate | Votes | % | ±% | |
|---|---|---|---|---|---|
| Democratic | Eddie Bernice Johnson (incumbent) | 86,322 | 75.7 | −6.8 | |
| Republican | Stephen E. Broden | 24,668 | 21.6 | +5.7 | |
| Libertarian | J.B. Oswalt | 2,988 | 2.7 | +1.1 | |
| Majority | 61,654 | 54.1 | |||
| Turnout | 113,978 | ||||
| Democratic hold | Swing | ||||
2012
[edit]| Party | Candidate | Votes | % | ±% | |
|---|---|---|---|---|---|
| Democratic | Eddie Bernice Johnson (incumbent) | 171,059 | 78.8 | +3.1 | |
| Republican | Travis Washington Jr. | 41,222 | 19.0 | −2.6 | |
| Libertarian | Ed Rankin | 4,733 | 2.2 | −0.5 | |
| Majority | 129,837 | 59.8 | |||
| Turnout | 217,014 | ||||
| Democratic hold | Swing | ||||
2014
[edit]| Party | Candidate | Votes | % | ±% | |
|---|---|---|---|---|---|
| Democratic | Eddie Bernice Johnson (incumbent) | 93,041 | 88.0 | +9.2 | |
| Libertarian | Max W. Koch III | 7,154 | 6.8 | +4.6 | |
| Independent | Eric LeMonte Williams | 5,598 | 5.2 | N/A | |
| Majority | 85,887 | 81.2 | |||
| Turnout | 105,793 | ||||
| Democratic hold | Swing | ||||
2016
[edit]| Party | Candidate | Votes | % | ±% | |
|---|---|---|---|---|---|
| Democratic | Eddie Bernice Johnson (incumbent) | 170,502 | 77.9 | −10.1 | |
| Republican | Charles Lingerfelt | 41,518 | 19.0 | N/A | |
| Libertarian | Jarrett R. Woods | 4,753 | 2.2 | −4.6 | |
| Green | Thom Prentice | 2,053 | 0.9 | N/A | |
| Majority | 128,984 | 59.0 | |||
| Turnout | 218,826 | ||||
| Democratic hold | Swing | ||||
2018
[edit]| Party | Candidate | Votes | % | ±% | |
|---|---|---|---|---|---|
| Democratic | Eddie Bernice Johnson (incumbent) | 166,784 | 91.1 | +13.2 | |
| Libertarian | Shawn Jones | 16,390 | 8.9 | +6.7 | |
| Majority | 150,394 | 82.1 | |||
| Turnout | 183,174 | ||||
| Democratic hold | Swing | ||||
2020
[edit]| Party | Candidate | Votes | % | ±% | |
|---|---|---|---|---|---|
| Democratic | Eddie Bernice Johnson (incumbent) | 204,664 | 77.5 | −13.6 | |
| Republican | Tre Pennie | 48,608 | 18.4 | N/A | |
| Independent | Eric LeMonte Williams | 10,834 | 4.1 | N/A | |
| Majority | 156,056 | 59.1 | |||
| Turnout | 264,106 | ||||
| Democratic hold | Swing | ||||
2022
[edit]| Party | Candidate | Votes | % | ±% | |
|---|---|---|---|---|---|
| Democratic | Jasmine Crockett | 134,876 | 74.7 | −2.8 | |
| Republican | James Rodgers | 39,209 | 21.7 | +3.3 | |
| Independent | Zachariah Manning | 3,820 | 2.1 | N/A | |
| Libertarian | Phil Gray | 1,870 | 1.0 | N/A | |
| Write-in | Debbie Walker | 738 | 0.41 | N/A | |
| Total votes | 180,513 | 100.0 | |||
| Democratic hold | Swing | ||||
Historical district boundaries
[edit]


In popular culture
[edit]- The 30th congressional district plays a role in the first part of season 4 of House Of Cards. Claire Underwood seeks to run for the seat after a disagreement with her husband, the President. The prominently black and Hispanic seat is reluctant to back Claire, and she eventually backs down.
See also
[edit]References
[edit]- ^ "Congressional Districts Relationship Files (State-based)". U.S. Census Bureau. Archived from the original on April 2, 2013.
- ^ a b "My Congressional District".
- ^ a b "2022 Cook PVI: District Map and List". Cook Political Report. Retrieved January 10, 2023.
- ^ https://davesredistricting.org/maps#viewmap::1c2c1e0d-2fd1-43a8-a039-73e7023124d1
- ^ "District Population Analysis with County Subtotals | CONGRESSIONAL DISTRICTS - PLANC2100" (PDF). Capitol Data Portal. Texas Legislative Council. August 26, 2021. Archived (PDF) from the original on June 27, 2022. Retrieved January 1, 2023.
- ^ "District Population Analysis with County Subtotals | CONGRESSIONAL DISTRICTS - PLANC2193" (PDF). Capitol Data Portal. Texas Legislative Council. October 17, 2021. Archived (PDF) from the original on December 25, 2022. Retrieved January 1, 2023.
- ^ 517 U.S. 952 (1996)
